


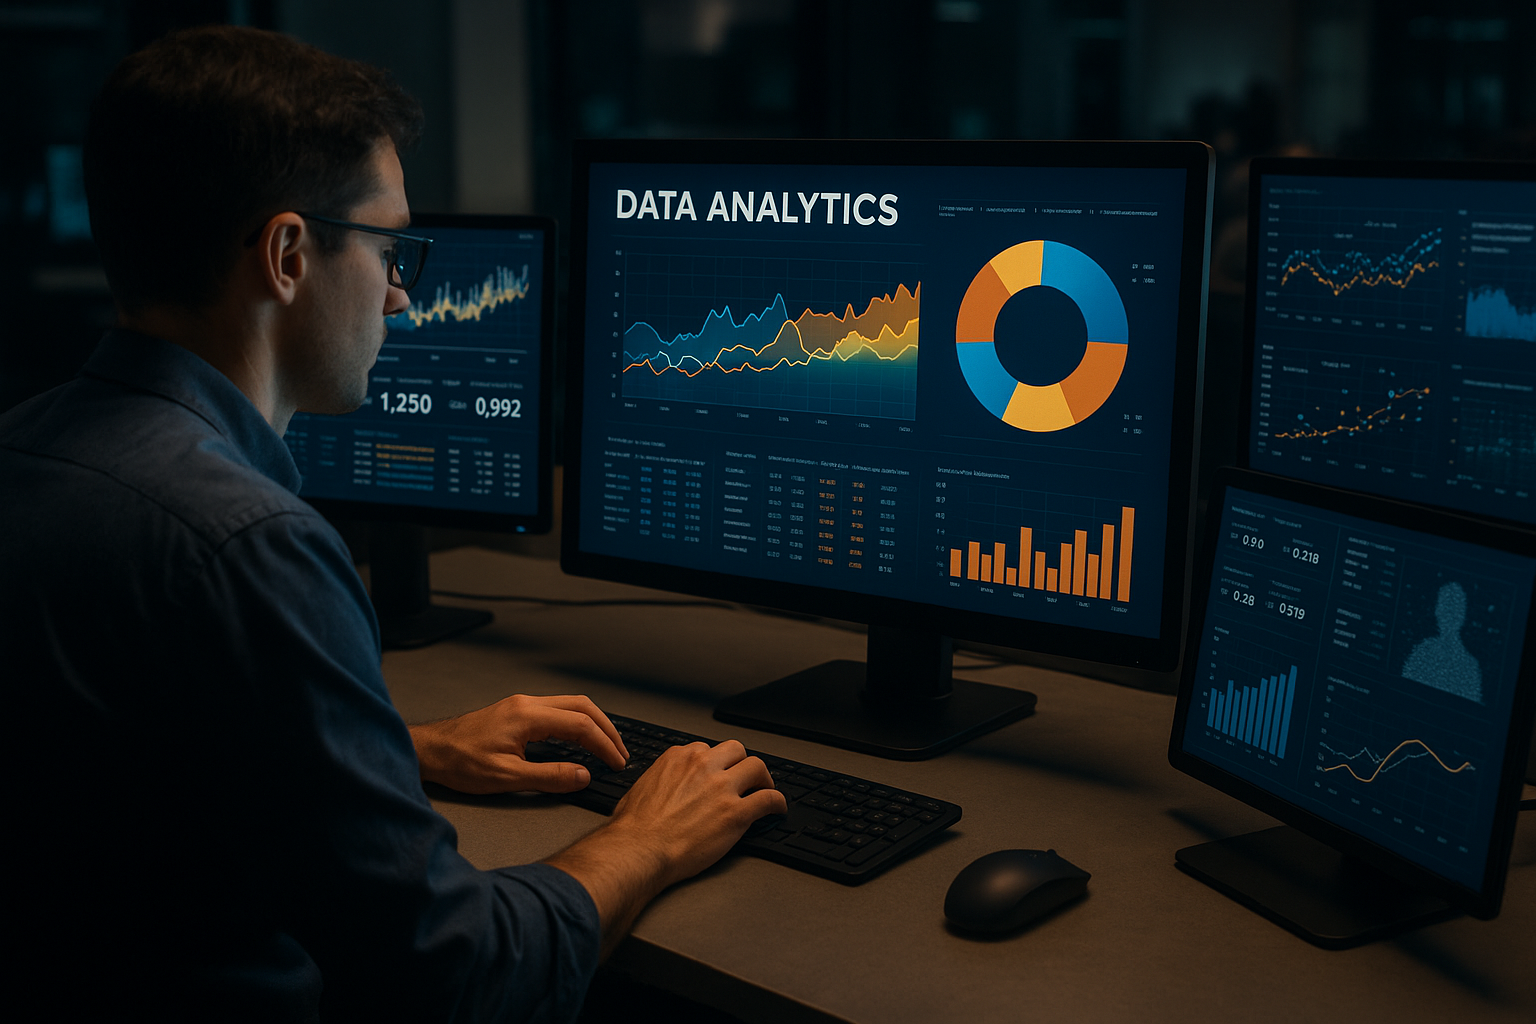
Explore the latest trends and innovations in big data analytics, including real-time data processing, AI integration, and its transformative...
Explore the latest trend of using big data analytics to enhance decision-making processes in businesses. Learn how real-time insights are tr...
Top News


Big data

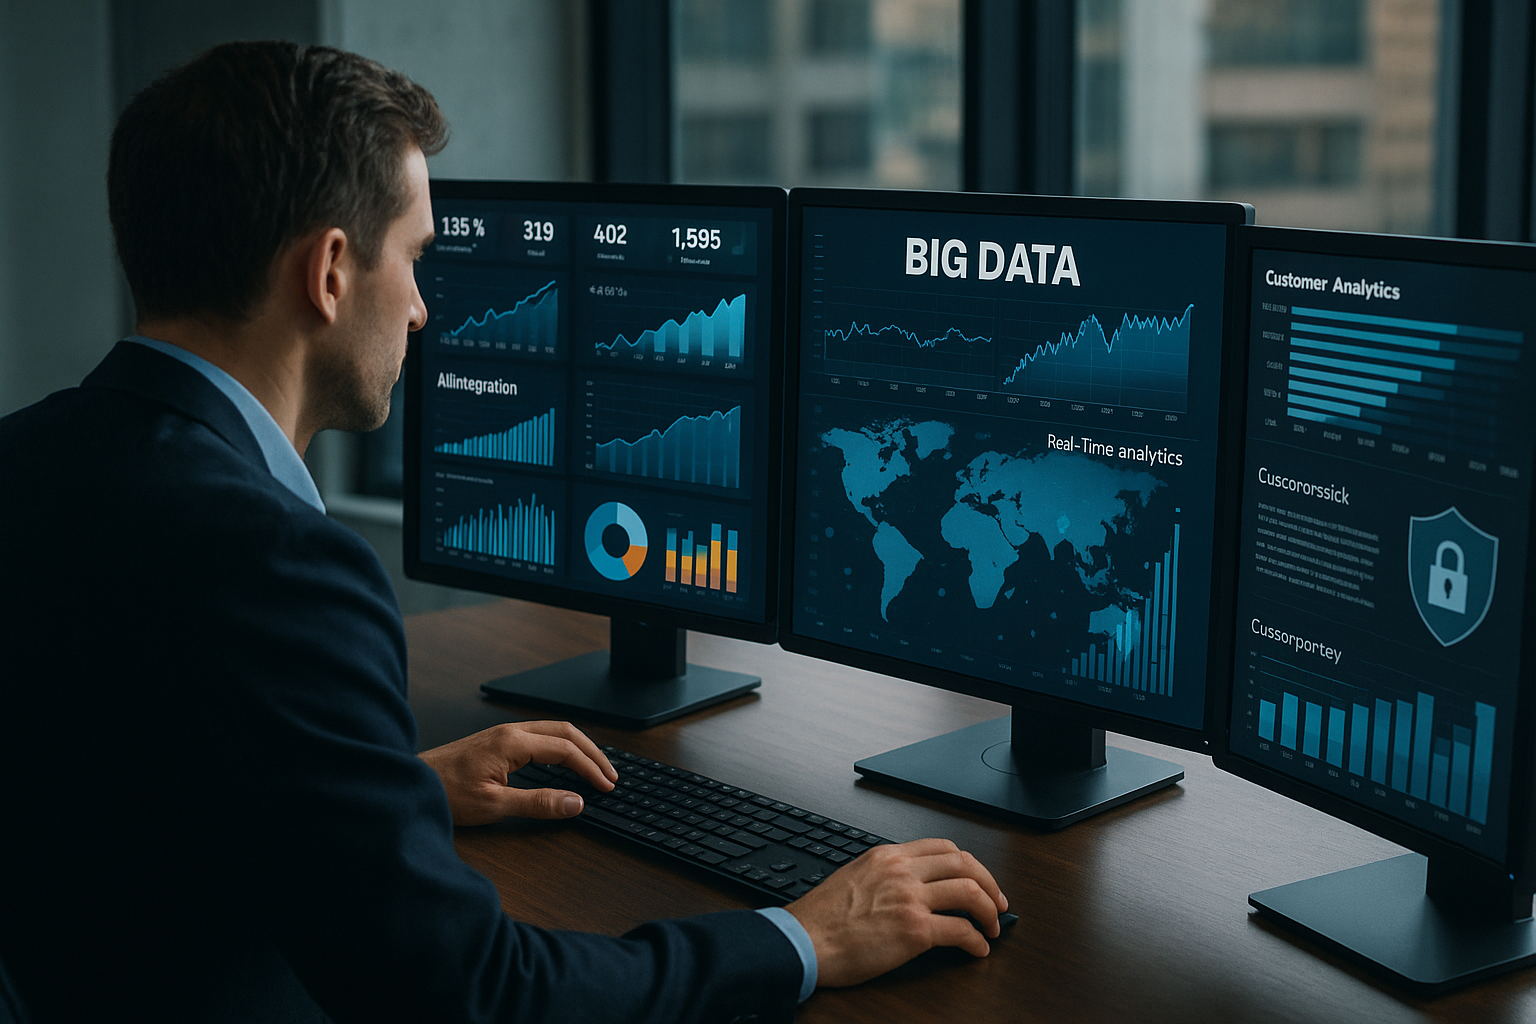
Explore the latest trend of using big data analytics to enhance decision-making processes in businesses. Learn how real-time insights are transforming strategies and outcomes.
Wednesday, 08 July 2026
Read more
-
Navigating the Expanding Landscape of Big Data: Trends and Insights
 Wednesday, 08 July 2026
 -
Harnessing Big Data to Predict Consumer Trends in 2023
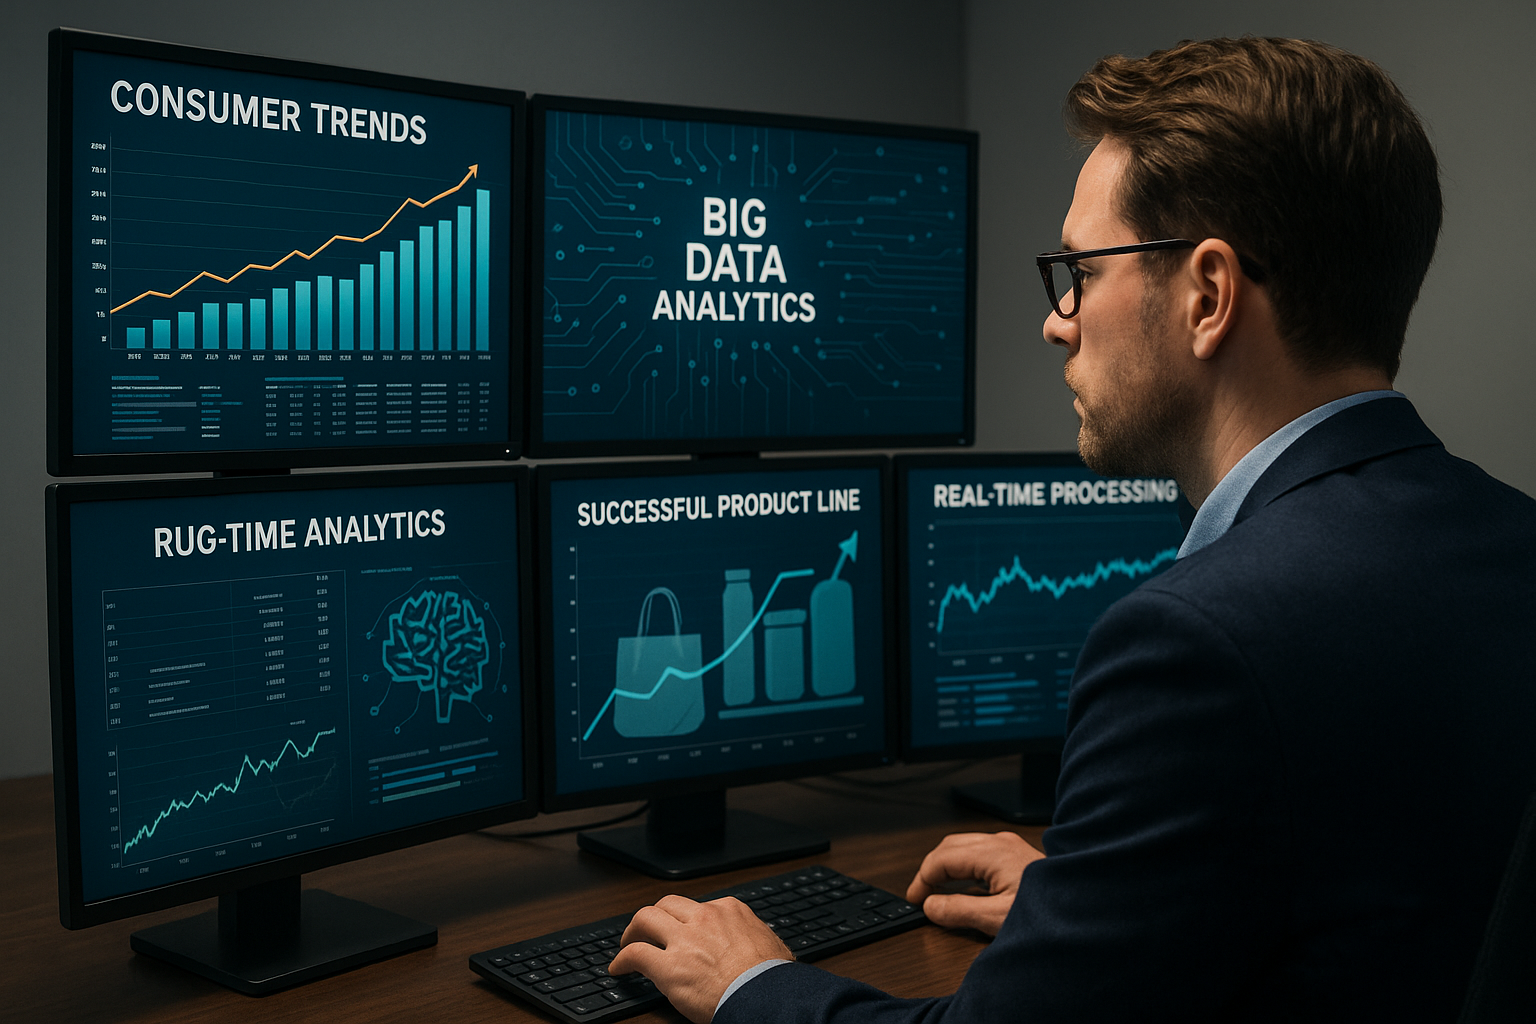 Wednesday, 08 July 2026
 -
Harnessing Big Data in Healthcare: A New Dawn for Patient Care
 Wednesday, 08 July 2026
 -
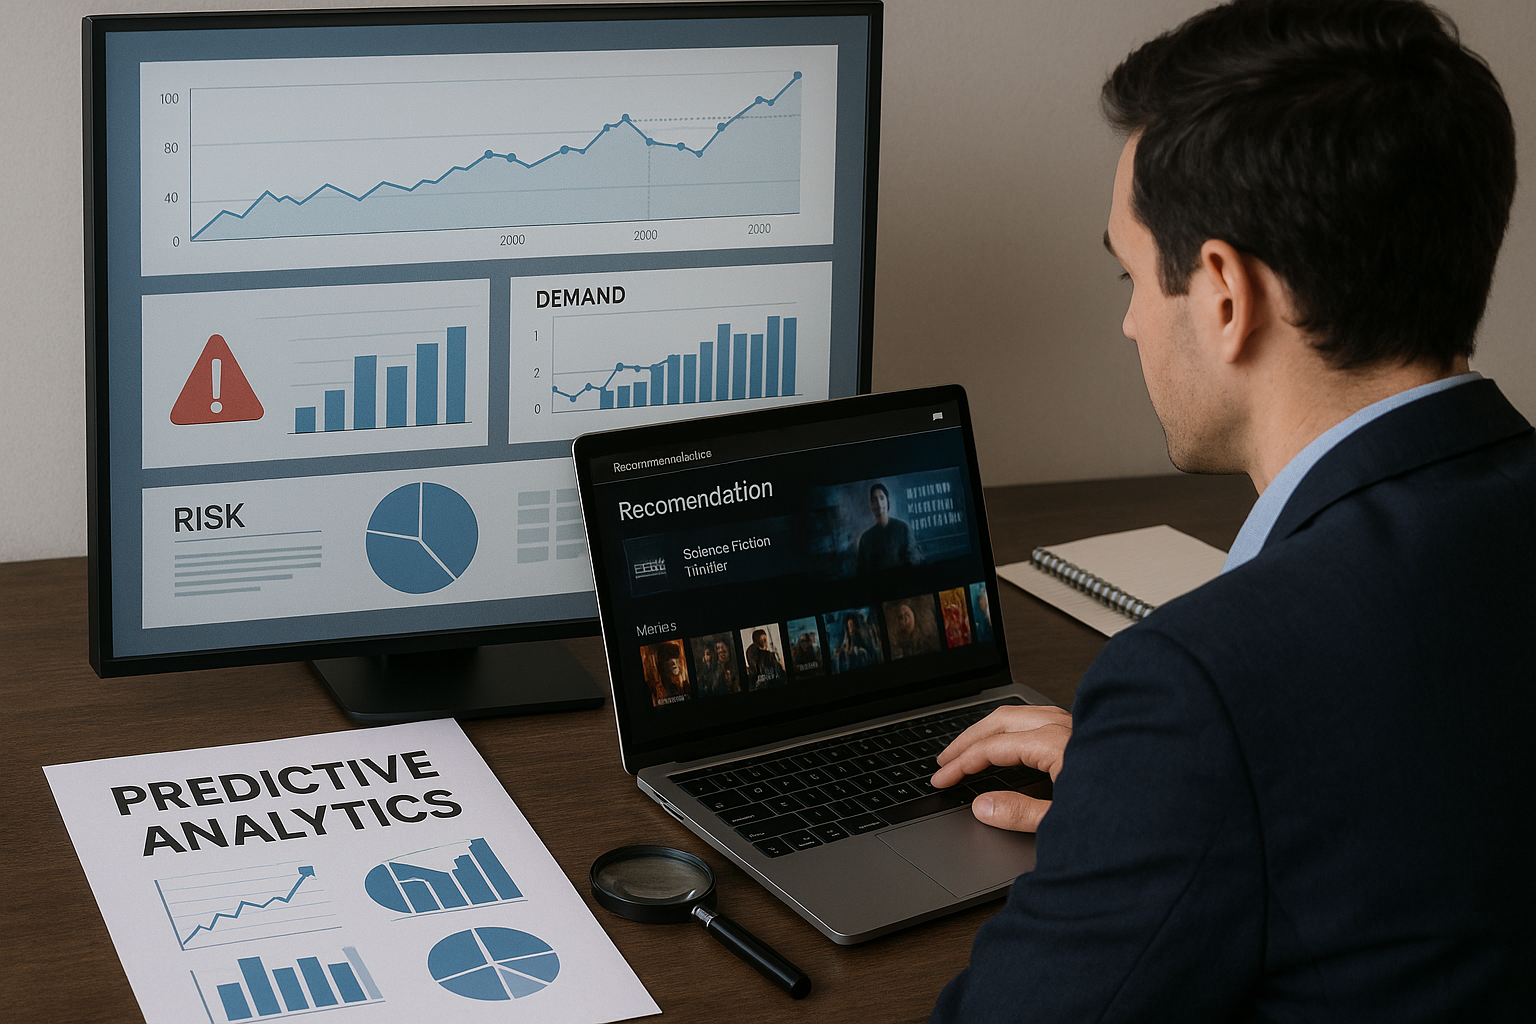
The Rise of Predictive Analytics in the Big Data Landscape
 Saturday, 09 May 2026
Glossary

Ever since the invention of computers many developments have shaped human lives. The invention of the internet was a landmark achievement which set up the stage for more things that followed. Many would have thought that the internet was the biggest thing ever but it was only a lead-in to developments in the world of big data, AI and IoT. Big data, AI and IoT have revolutionized the world we live in but what exactly are these terms?
Monday, 18 March 2019
Read more
-
What Is Big Data Analytics And Why Do Companies Use It?
 Monday, 04 March 2019
 Explore the rise of AI providers in the big data ecosystem focusing on analytics, efficiency, and the democratization of AI-driven solutions for businesses.
 Explore the rise of innovative data providers transforming data management with advanced analytics and enhanced security solutions. Discover how businesses are leveraging these providers to drive success and boost decision-making.
 Explore how big data providers like Google Cloud and AWS are transforming the market with innovative solutions, enhancing analytics, and data management.
 Explore the growing trend of advanced data visualization tools in big data analytics, highlighting AI integration and real-world applications for business insights.
 Explore how automation tools are revolutionizing data analytics by improving efficiency, accuracy, and security, empowering businesses to make strategic decisions.
 Discover how optimizing big data tools can transform business operations and improve decision-making processes with real-time insights.
 Explore how modern data analytics tools are driving business growth by transforming raw data into actionable insights. Learn about the latest trends in AI-driven analytics, user-friendly interfaces, predictive analysis, and real-time data processing.
Popular Articles
- Most read
- Most commented
Recent Articles
Explore the latest trends and innovations in big data analytics, including real-time data processing, AI integration, and its transformative effects in sectors like healthcare.
Sunday, 26 July 2026
Explore the latest trend of using big data analytics to enhance decision-making processes in businesses. Learn how real-time insights are transforming strategies and outcomes.
Wednesday, 08 July 2026
Explore the latest trends in big data, including real-time data processing, AI integration, and the rise of cloud platforms. Learn how these developments are reshaping business strategies.
Wednesday, 08 July 2026
Explore how big data analytics is revolutionizing the prediction of consumer trends in 2023. Discover real-life cases and challenges companies face in leveraging data effectively.
Wednesday, 08 July 2026

Explore how analytics is revolutionizing the accounting industry, with a focus on predictive analytics and data-driven financial decision-making.
Wednesday, 08 July 2026
Explore the current trends in big data and analytics, and how companies are using these technologies to improve business operations. Learn about real-time analytics, AI integration, and data-driven decision making.
Wednesday, 08 July 2026